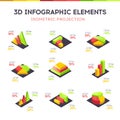
colorful geometric financial charts and diagrams bar graph pie chart |
||||||||||||||||||||||||||||||||||||||||
| navigate by keyword : financial charts bar graph pie chart donut data visualization business analytics growth progress statistics colorful geometric rendering abstract conceptual presentation infographic report analysis strategy planning success finance economy investment market trends digital art modern clean simple bright vibrant blue orange green pink yellow light white |
||||||||||||||||||||||||||||||||||||||||
|
||||||||||||||||||||||||||||||||||||||||
| A 3D render of colorful geometric shapes representing financial data. Includes a bar graph, a donut chart, and an upward trending arrow. The objects are arranged on a blue circular platform against a black background |
||||||||||||||||||||||||||||||||||||||||
|
Stockphotos.ro (c) 2025. All stock photos are provided by Dreamstime and are copyrighted by their respective owners. |
||||||||||||||||||||||||||||||||||||||||