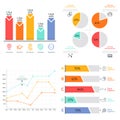
colorful financial data visualization with graph and chart elements |
||||||||||||||||||||||||||||||||||||||||
navigate by keyword : finance data visualization graph chart technology analysis market trends investment growth decline industry digital colorful design abstraction statistics economy numbers information business modern software algorithm metrics monitoring performance intelligence analytics background tools graphic pattern points art creative vibrant aesthetics futuristic strategy visual dynamic interactive |
||||||||||||||||||||||||||||||||||||||||
|
||||||||||||||||||||||||||||||||||||||||
Vibrant financial data visualization featuring colorful graphs and charts, perfect for illustrating trends and analytics in the finance industry. Generative AI |
||||||||||||||||||||||||||||||||||||||||
Stockphotos.ro (c) 2025. All stock photos are provided by Dreamstime and are copyrighted by their respective owners. |