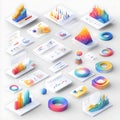
colorful business data visualization elements for digital reports |
||||||||||||||||||||||||||||||||||||||||
navigate by keyword : visualization visual vibrant user trend tools technology tablet strategy statistics software smartphone representation reports reporting report presentations presentation pie performance perfect modern metrics marketing line layout interface insights insight information infographic ideal graphs graphical graph explore enhancing elements display digital design datadriven data dashboard creative communication colorful color collection charts chart business bar analytics analysis |
||||||||||||||||||||||||||||||||||||||||
|
||||||||||||||||||||||||||||||||||||||||
Explore a vibrant collection of digital data visualization elements perfect for reports and presentations. Ideal for enhancing business analytics and insights |
||||||||||||||||||||||||||||||||||||||||
Stockphotos.ro (c) 2025. All stock photos are provided by Dreamstime and are copyrighted by their respective owners. |