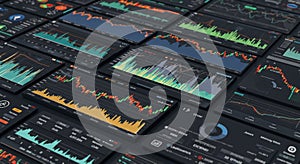
collection multiple digital dashboards displaying financial and data |
||||||||||||||||||||||||||||||||||||||||
navigate by keyword : visualizations visible use typical trends technology statistics sleek signage showing screenshot screens represents prominent pie pattern organized multiple multimedia modern metrics markets machine line likely laptop interfaces indicators guitar gridlike graphs generated games gadget font fluctuating financial features enhance electronics displaying digital design data dashboards dashboard dark contrast colors collection charts bar backgrounds analytics |
||||||||||||||||||||||||||||||||||||||||
|
||||||||||||||||||||||||||||||||||||||||
A collection of multiple digital dashboards displaying financial and data visualizations. Each dashboard features line graphs, bar charts, and pie charts in various colors, showing fluctuating data trends. The screens are organized in a grid-like pattern, with prominent use of dark backgrounds to enhance contrast. The data likely represents financial markets, analytics, and statistics, with various metrics and indicators visible. The design is sleek and modern, typical of financial technology interfaces. |
||||||||||||||||||||||||||||||||||||||||
Stockphotos.ro (c) 2025. All stock photos are provided by Dreamstime and are copyrighted by their respective owners. |