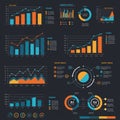
collection data visualizations dark background featuring various charts and graphs |
||||||||||||||||||||||||||||||||||||||||
navigate by keyword : advertising banner brand design diagram font gadget games intrior line logo modern multimedia number office poster presentation screenshot signage text |
||||||||||||||||||||||||||||||||||||||||
|
||||||||||||||||||||||||||||||||||||||||
A collection of data visualizations on a dark background, featuring various charts and graphs. Bar charts, pie charts, and line graphs are prominently displayed, using contrasting colors like sky blue, red, and yellow to differentiate data sets. Circular and rectangular elements represent different metrics, conveying complex information in a structured format. This design likely serves to illustrate statistical data, trends, or analytics in an informative and visually engaging manner. |
||||||||||||||||||||||||||||||||||||||||
Stockphotos.ro (c) 2025. All stock photos are provided by Dreamstime and are copyrighted by their respective owners. |