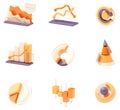
business infographics set with different diagrams vector illustration |
||||||||||||||||||||||||||||||||||||||||
| navigate by keyword : infograph graphic diagram info vector circle chart step design graph business venn skill level abstract concept template banner teamwork layout cycle web project background plan presentation data technology finance information report illustration success growth progress startup performance options strategy leader marketing number statistic percent element research sign |
||||||||||||||||||||||||||||||||||||||||
|
||||||||||||||||||||||||||||||||||||||||
| Business infographics set with different diagrams vector illustration. Level elements, marketing charts, graphs, pyramid and venn diagram for your work presentation. |
||||||||||||||||||||||||||||||||||||||||
|
Stockphotos.ro (c) 2025. All stock photos are provided by Dreamstime and are copyrighted by their respective owners. |
||||||||||||||||||||||||||||||||||||||||