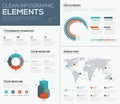
business data visualization with pie chart bar graph and world map

navigate by keyword : pie chart bar graph world map data statistics analytics business infographic presentation report percentage global location pins icons design modern clean financial growth progress success strategy marketing research technology information diagram concept visualization digital corporate management planning economy trends

Business data visualization with pie chart, bar graph, and world map Royalty Free Stock Photo
Analytics dashboard. Business statistics charts, financial graphs and data visualization widgets with bar chart, line graph Royalty Free Stock Photo
Complex data visualization with charts graphs and statistical analysis showing pie charts bar graphs and world map for business Royalty Free Stock Photo
Statistical infographics presentation slides. Business data analysis charts, pie graphs, bar diagrams, line graphs and world map Royalty Free Stock Photo
A vibrant digital interface displaying a world map with various graph types, including bar, line, and pie charts. The data is Royalty Free Stock Photo
Global Business Growth Hologram with 3D Charts and World Map in Modern Office Royalty Free Stock Photo
Business data visualization with pie chart, bar graph, and world map
Displaying large circular pie chart overlaying calm lakeside water, with world map and line graph Royalty Free Stock Photo
World map and pie chart data visualization vector infographics Royalty Free Stock Photo
Global Business Growth Hologram with 3D Charts and World Map in Modern Office Royalty Free Stock Photo
Senior man wearing plaid blazer analyzing floating bar and pie charts in office, with world map Royalty Free Stock Photo
Showing finance dashboard in virtual interface with pie chart, bar graphs and world map icons Royalty Free Stock Photo
Data dashboard floating on grid, showing percentage metrics world map, pie, bar and line charts Royalty Free Stock Photo
Finance infographics presentation slides. Business report charts, data visualization and analysis graphs, bar and pie diagrams Royalty Free Stock Photo
A clean and modern infographic-style image showcasing business data. Features a prominent 75% pie chart, a three-category bar graph with icons, and a world map with location pins. Ideal for presentations, reports, and web design related to global business, statistics, and analytics.


Stockphotos.ro (c) 2025. All stock photos are provided by Dreamstime and are copyrighted by their respective owners.