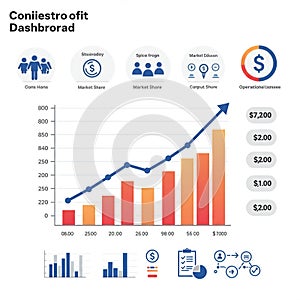
business dashboard displaying financial data features include bar graph with |
||||||||||||||||||||||||||||||||||||||||
| navigate by keyword : yaxis values upwardtrending text symbolize smaller showing share shades screenshot right red presentation plan overlaid orange operational numerical multimedia monetary metrics market map logo line like left labeled insights increasing include illustrating icons handwriting growth graph glance generated font financial fictional features expenses drawing document displaying diagram data dashboard colorcoded circle charts chart cartoon business brand bottom bar aligned |
||||||||||||||||||||||||||||||||||||||||
|
||||||||||||||||||||||||||||||||||||||||
| Business dashboard displaying financial data. Features include a bar graph with an upward-trending line overlaid, showing growth from left to right with increasing numerical values on the y-axis. Icons above the graph symbolize various business metrics like market share and operational expenses, labeled in a fictional text. The chart is color-coded in shades of red and orange. Additional smaller charts and monetary values are aligned on the bottom and right, illustrating data insights at a glance. |
||||||||||||||||||||||||||||||||||||||||
|
Stockphotos.ro (c) 2025. All stock photos are provided by Dreamstime and are copyrighted by their respective owners. |
||||||||||||||||||||||||||||||||||||||||