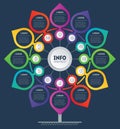
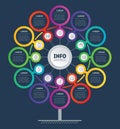
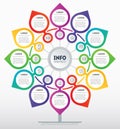
annual report segmented into months tree infographic technology education process brochure design template |
||||||||||||||||||||||||||||||||||||||||
navigate by keyword : annual background brochure business circle color concept connected customer cycle data design diagram element funnel graph graphic icon info infographic information layout marketing months options pipeline plan point presentation process project purchase report sales sign square step strategy symbol technology template tree twelve vector year |
||||||||||||||||||||||||||||||||||||||||
|
||||||||||||||||||||||||||||||||||||||||
Annual report is segmented into 12 months. Tree or Infographic of technology or education process. Brochure design template. Business presentation concept with Twelve options, steps |
||||||||||||||||||||||||||||||||||||||||
Stockphotos.ro (c) 2025. All stock photos are provided by Dreamstime and are copyrighted by their respective owners. |