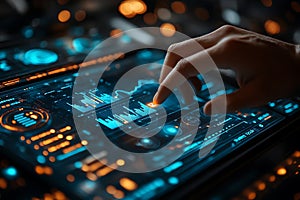
analyzing data with touchscreen display showing charts and graphs for business intelligence |
||||||||||||||||||||||||||||||||||||||||
navigate by keyword : data analysis visualization business intelligence big technology digital information analytics charts graphs touchscreen screen interface futuristic hand finger touching interacting monitoring performance dashboard progress processing glowing blue orange illuminated bokeh modern innovation artificial trend market statistics report transformation internet iot future science research |
||||||||||||||||||||||||||||||||||||||||
|
||||||||||||||||||||||||||||||||||||||||
Visualize insightful data analysis using a modern touchscreen display. This image showcases business intelligence through interactive charts and graphs, ideal for analytics and digital transformation reports. Use for AI, big data |
||||||||||||||||||||||||||||||||||||||||
Stockphotos.ro (c) 2025. All stock photos are provided by Dreamstime and are copyrighted by their respective owners. |