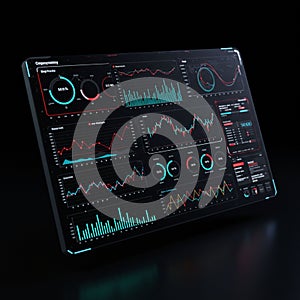
high tech digital dashboard featuring various data visualizations including line and |
||||||||||||||||||||||||||||||||||||||||
navigate by keyword : visualizations trends text technology suggests signage show sections screenshot representing red presentation organized operations number multimedia monitoring metrics management line likely like lighting light interface including hues hightech grids graphs gauges gadget futuristic font fluctuating finance fields featuring electronics digital design data dashboard circular charts categories brand blue black bar background analysis aigenerated advertising advanced |
||||||||||||||||||||||||||||||||||||||||
|
||||||||||||||||||||||||||||||||||||||||
A high-tech digital dashboard featuring various data visualizations, including line and bar charts, circular gauges, and data grids. The interface predominantly uses red and blue hues against a black background. Graphs show fluctuating trends and are organized into sections, likely representing different metrics or categories. The futuristic design suggests it's for advanced data analysis or monitoring, potentially in fields like finance, technology, or operations management. |
||||||||||||||||||||||||||||||||||||||||
Stockphotos.ro (c) 2025. All stock photos are provided by Dreamstime and are copyrighted by their respective owners. |