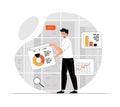
professional data analytics dashboard with charts and graphs for business analysis |
||||||||||||||||||||||||||||||||||||||||
navigate by keyword : data analytics dashboard charts graphs business analysis big visualization statistics financial technology reporting information insights growth trends performance metrics presentation digital marketing strategy infographic report software design finance management kpis intelligence decision making monitoring analyzing progress market forecasting |
||||||||||||||||||||||||||||||||||||||||
|
||||||||||||||||||||||||||||||||||||||||
Data Analytics Dashboard with Charts Graphs and Progress illustrates an analytical dashboard with various charts, graphs, and progress bars, visualizing data insights in a sleek and organized manner. |
||||||||||||||||||||||||||||||||||||||||
Stockphotos.ro (c) 2025. All stock photos are provided by Dreamstime and are copyrighted by their respective owners. |