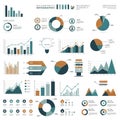
infographic with various chart types including bar graphs line pie charts |
||||||||||||||||||||||||||||||||||||||||
| navigate by keyword : visually types text style statistical serve screenshot representing providing presentation points plan placeholders pie percentage people orange multimedia modern markers map mail lorem logo line like labeled items ipsum insights infographic indicators including includes icons gray graphs font efficiently drawing dominant document diagrams diagram detailed design descriptive data currency conveying colors clean circular circle charts |
||||||||||||||||||||||||||||||||||||||||
|
||||||||||||||||||||||||||||||||||||||||
| Infographic with various chart types, including bar graphs, line graphs, pie charts, and circular diagrams. Dominant colors are orange, blue, and gray. Each chart includes detailed data points and icons representing items like currency, mail, and people. Circular percentage indicators accompany several charts, providing data insights. Text placeholders labeled "Lorem Ipsum" serve as descriptive markers. The design style is clean and modern, aimed at visually conveying statistical data efficiently. |
||||||||||||||||||||||||||||||||||||||||
|
Stockphotos.ro (c) 2025. All stock photos are provided by Dreamstime and are copyrighted by their respective owners. |
||||||||||||||||||||||||||||||||||||||||