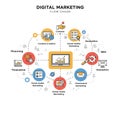
flowchart illustrating process for system central elements connected |
||||||||||||||||||||||||||||||||||||||||
| navigate by keyword : violet user units transfer text technological system symbolize stages signify screenshot screens purple processing process presentation predictive poster points pink pattern outlined organ nodes neon modeling logo lines line layout labels key involved interfaces interaction include illustrating identify icons gradient generated gears font flowchart features execution engagement elements diagram design database data connected components code circular circle central cartoon brand blue binary background aspects art |
||||||||||||||||||||||||||||||||||||||||
|
||||||||||||||||||||||||||||||||||||||||
| Flowchart illustrating a process for an AI system. Central elements connected by arrows include a database, processing units, user interaction interfaces, and data analysis nodes. The layout features neon lines in blue and pink against a gradient background. Outlined icons suggest data transfer, algorithm execution, and user engagement. Labels such as "Predictive Modeling" and "Data Analysis" identify different stages or components. Circular nodes signify key points, while screens, gears, and binary code symbolize the technological aspects involved. |
||||||||||||||||||||||||||||||||||||||||
|
Stockphotos.ro (c) 2025. All stock photos are provided by Dreamstime and are copyrighted by their respective owners. |
||||||||||||||||||||||||||||||||||||||||