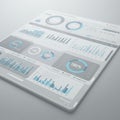
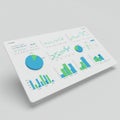
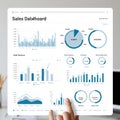
digital dashboard with various data visualizations including bar graphs line |
||||||||||||||||||||||||||||||||||||||||
navigate by keyword : writing visualizations text techoriented suggests statistical sleek signage shades representing professional presentation poster performance multimedia modern metrics line lighting light layout label interpretation interface including gray graphs gadget font focusing financial environment electronics dominant document digital diagram design data dashboard colors clean circular charts cash business brand blue bar banner analysis aigenerated advertising |
||||||||||||||||||||||||||||||||||||||||
|
||||||||||||||||||||||||||||||||||||||||
Digital dashboard with various data visualizations, including bar graphs, line graphs, and circular charts on a sleek, light gray interface. Dominant colors are shades of blue and gray. The layout is clean and modern, representing statistical or business metrics, possibly for financial or performance analysis. The design suggests a professional and tech-oriented environment, focusing on data presentation and interpretation. |
||||||||||||||||||||||||||||||||||||||||
Stockphotos.ro (c) 2025. All stock photos are provided by Dreamstime and are copyrighted by their respective owners. |