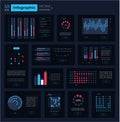
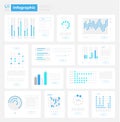
business development results infographic chart design template set

navigate by keyword : infographic statistics vector editable set information research study result analytics science chart template graph data diagram dashboard bars waterfall graphic report circle percentage line histogram design piechart layout infochart pack bundle visualization infograph info stats presentation business process customizable personalize creative simple option number orange

Business development results infographic chart design template set Royalty Free Stock Photo
Vector set of isometric infographic elements. Different types of graphs and diagrams. Modern 3D style. Design for Royalty Free Stock Photo
Set of various diagrams, graphs of growth and development with percents and schematic arrows. Hand drawn vector Royalty Free Stock Photo
Infographic performance UI elements kit Royalty Free Stock Photo
Infographic visualization UI elements kit Royalty Free Stock Photo
   
   
Business development results infographic chart design template set
graph pie icon. Element of simple icon for websites, web design, mobile app, info graphics. Thin line icon for website design and Royalty Free Stock Photo


Business development results infographic chart design template set. Visual data presentation. Editable bar graphs and circular diagrams collection. Myriad Variable Concept font used


Stockphotos.ro (c) 2025. All stock photos are provided by Dreamstime and are copyrighted by their respective owners.